
Getting Visibility of Data Transfer with VPC Flow Logs, Part 1
Two approaches to using AWS' native network log service

Today I want to talk about using VPC Flow Logs to visualize data transfer using both CloudWatch and Athena. While today’s guide isn’t directly about measuring cost, being able to visualize data transfer in your environment is essential to do just that.
This is the first part in a (perhaps) multi-part series about this topic. Part 1 will be about how to set up flow logs and begin using queries with them.
In Part 2, I plan on taking this topic and going more in-depth about queries and the information that can be gathered. There might be a 3rd after that around advanced querying—time will tell.
Why Measuring Data Transfer Matters
Data transfer costs are a given in public cloud. While you can’t stop them, you can aim to reduce them or even avoid them.
One of the biggest challenges is gaining visibility. You can’t know where your transfer charges are if you don’t know how to visualize data transfer. Flow logs can help you do that.
There are many benefits to integrating VPC Flow Logs—visibility of network traffic, troubleshooting network issues, or simply building out a more robust monitoring solution.
The use case and key benefit I’m going to talk about in detail is using them to gather data transfer from point-to-point.
In the real world, you might use this across peered Transit Gateways in a multi-region setup, on a Gateway Load Balancer interface in a centralized inspection setup to monitor traffic, or in an egress VPC. All of these are valid places where you might want to apply flow logs to see who your biggest contributors are to data transfer.
Once you’ve identified the bytes of data transfer, you can then use that data to derive cost!
About VPC Flow Logs
Why VPC Flow Logs, you ask? Aren’t they just a network log tool?
You’re right, they are! However, flow logs are the most effective native tool to identify data transfer and from that, cost.
What are VPC Flow Logs?
As a refresher, flow logs are a way to track metadata of IP data moving over network interfaces. They can do all this without any interference to bandwidth or latency. Flow logs contain useful data, including Source and Destination IP with ports, bytes, network devices, accepts/rejects, and even flow direction. You can read about all of the fields here.
Just to be clear—flow logs don’t perform packet inspection. You need a 3rd party tool for that. The goal of this isn’t to inspect packets but rather to use that metadata to gather information about data transfer in your AWS environment.
How do you access flow logs? You have to put them somewhere first, and AWS currently has 3 places you can publish them: CloudWatch, an S3 bucket, and Kinesis Data Firehose.
The two methods I’ll cover today to read them are using CloudWatch, which is both a publication location and a tool to visualize them, as well as using Athena to query logs from an S3 bucket.
What’s the difference between these two options? Primarily ease of integration, timeliness, and cost. CloudWatch is the more robust and integrated option that can provide timely captures of network activity. Using Athena to query from S3 can only be done on an ad-hoc basis, but it’s also cheaper to use. This is a bit of an oversimplification, but for the purposes of what we’ll be doing today, this should cover it.
Method 1 - CloudWatch Logs + VPC Flow Logs
Method 1 is the easiest method because it directly integrates with a tool that most organizations leverage when they use AWS: CloudWatch. CloudWatch can perform logging and analysis for almost all resources in AWS, which makes it a preferred option.

/aws/vpc/flowlog X
stats sun(bytes) as bytesTransferred by srcAddr,
I sort bytes Transferred desc
I limit le
5m
30m
Export results
3h
12h
Custom (Iw)
Run query
Cancel
History
Quuies aæ to to 60 minutU.
@Complete
dstAddr
Showing I O of 149, 732 records matched@
Logs
12 PM
1B
Visua lization
Tue 30
Add to dashboard
149,732 records (136 MB) scanned in @ 14367 records's (1.7 MB's)
12 PM
wea 31
15375156794
196286%
329236
32898e
12 PM
12 PM
rn02
12 PM
sat 03
12 PM
Jun 04
12 PM
05
le.ø.e.1ø4
le.ø.e.31
198.144.1-
52.216.61—
3.5-19.164
s2.21'.16-
re. B. e .104
le.ø.e.31
le.ø.e.1ø4
le.ø.e.31
le.ø.e.1&4
le.ø.e.31
'1.246. 211.-")
To get visibility of VPC Flow Logs, you need to first create a flow log for a VPC or a network device.
This can be done by going to VPC => clicking on the VPC you want to monitor => clicking on the “Flow logs” tab at the bottom => and clicking “Create Flow Log.”
This will take you to the “Create flow log” wizard, pictured below:
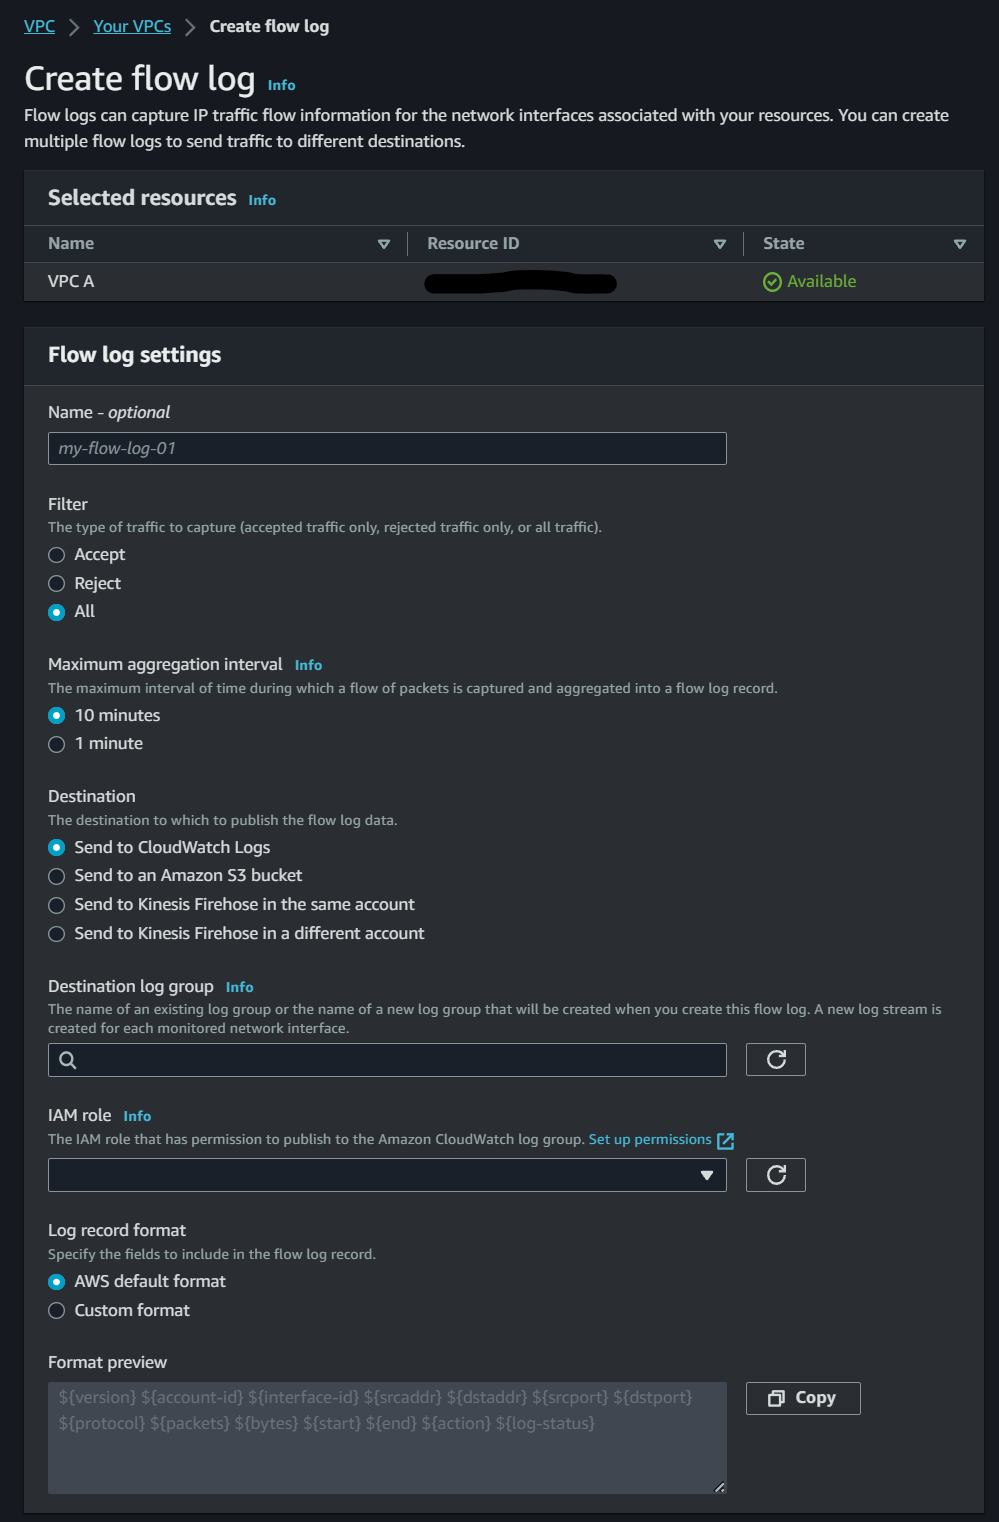
From this, you’ll select the aggregation interval, where you want to publish them, their log group (automatically created), an IAM role that can publish flow logs to CloudWatch, and finally, the log record format.
The log format is an important step since it determines all the information being gathered, so unless you’re just trying to be expedient it’s worth evaluating what you want to get out of your flow logs. That link I posted earlier has a description of the fields included in this selection.
Once you’re done there, click “Create flow log” and it will be set up. It typically takes 10 minutes to an hour for flow logs to aggregate for you to see, but once they’re there you can play around with them via the CloudWatch dashboard under “Logs” => “Log Insights.”
AWS is nice enough to provide some sample queries on the right side that can help you get started:
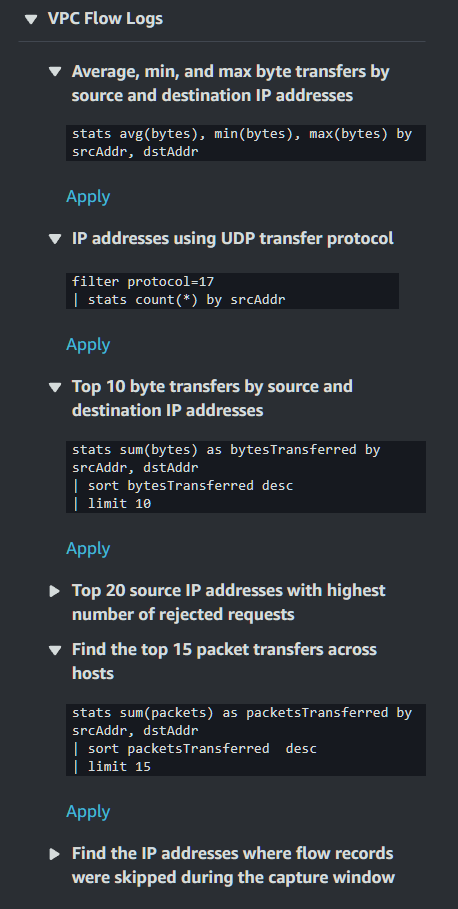
You’ll see I used a sample query earlier. You can, of course, write your own queries too! There is a bit of a learning curve with writing in CloudWatch in particular, but once you get the hang of it you can come up with some interesting queries.
Some of the fields I find to be essential for this are Packet Source and Destination, and Bytes.
Here’s one I made specifically to track bytes between 2 hosts:
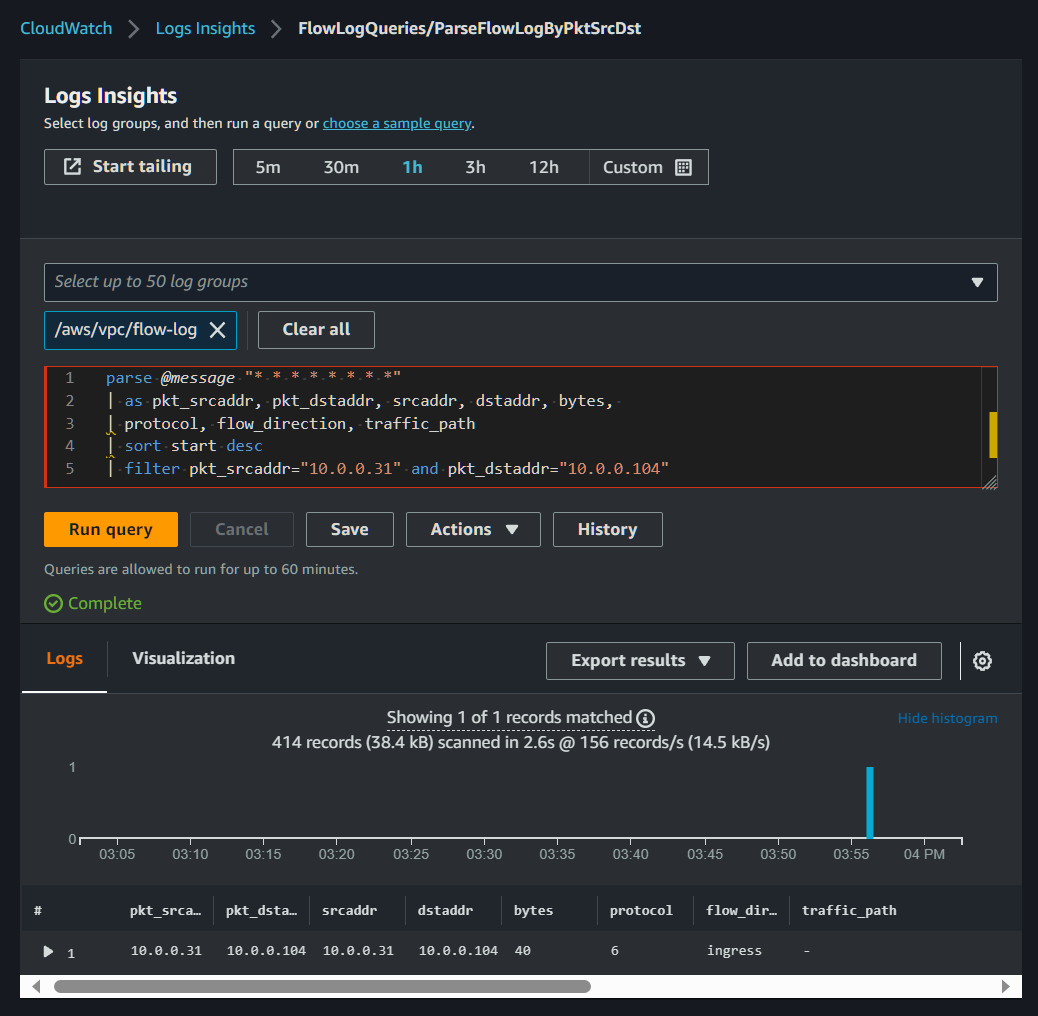
Admittedly, this is a very basic scenario, but your queries don’t have to be complicated to be effective. If you’re already somewhat aware of a big talker in your environment, or of a key point of ingress/egress, you can certainly use a simple query to identify traffic moving through that VPC or across an interface.
On the other hand, there are many fields in VPC Flow Logs that offer you high levels of detail about traffic. Personally, I’m exploring the use of the flow_direction and traffic_path fields, which identify traffic direction and the devices involved respectively.
Finding use cases within your organization might take some experimentation, but there’s almost certainly a way to capture it with a flow logs query.
Then, once you’ve determined your queries to measure data transfer, you can then add them to your CloudWatch dashboards.
Method #2 Athena Queries of S3
This method is a great second option and might even be a better choice in certain cases.
Storing logs in S3 is the cheaper option, at roughly 50% of the cost of using CloudWatch Logs. Additionally, Athena queries are SQL-based, which unlike CloudWatch is something many people are already familiar with. Lastly, Athena queries are pay-per-query.
While it might not provide the integrations and dashboard functionality, it’s a great tool to use on an ad-hoc basis to query and read logs.
So how can you set up Flow Logs with Athena and S3?
First, you’ll want to create a Flow Log like before, except this time you’ll choose the S3 storage option. You’ll go through the above options from the first example, as well as setting an S3 bucket destination, and choosing a log record format. You can store your logs in Apache Parquet format, which depending on your needs might be the right choice and is also cheaper to store than text format.
After creating the new flow log, you’ll want to head back to your console to create an Athena integration that uses CloudFormation to set up. While you might opt to do it manually (been there, tested that)…I highly recommend going with the integration. It’s so much simpler to set up, much easier to remove, and works better overall and even comes with a few free extras.
Under the flow logs tab, select your newly created S3 bucket of flow logs and go to “Actions” => “Generate Athena integration.”
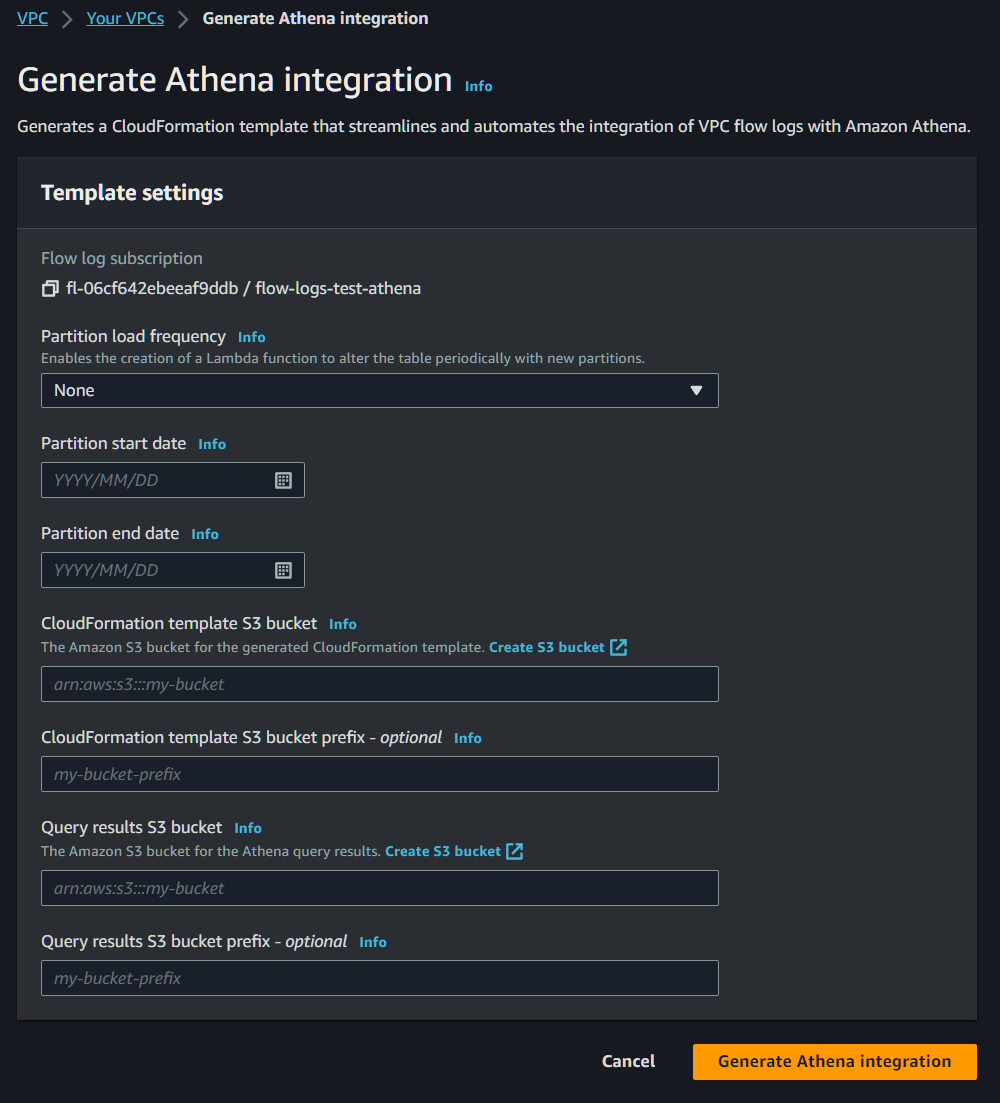
From here you’ll select your partition load frequency (Daily, Weekly, Monthly), which schedules a Lambda function to alter your table with new partitions. You’ll choose that start and end date of that partition, as well as the bucket where you want to store your CloudFormation template, and your query results bucket. Now click on “Generate Athena integration.”
At this point it will take a few minutes to build it, but once it’s made it gets drastically easier.
Head over to Athena and you’ll find that it’s generated a new database with a new table, under a new workgroup.
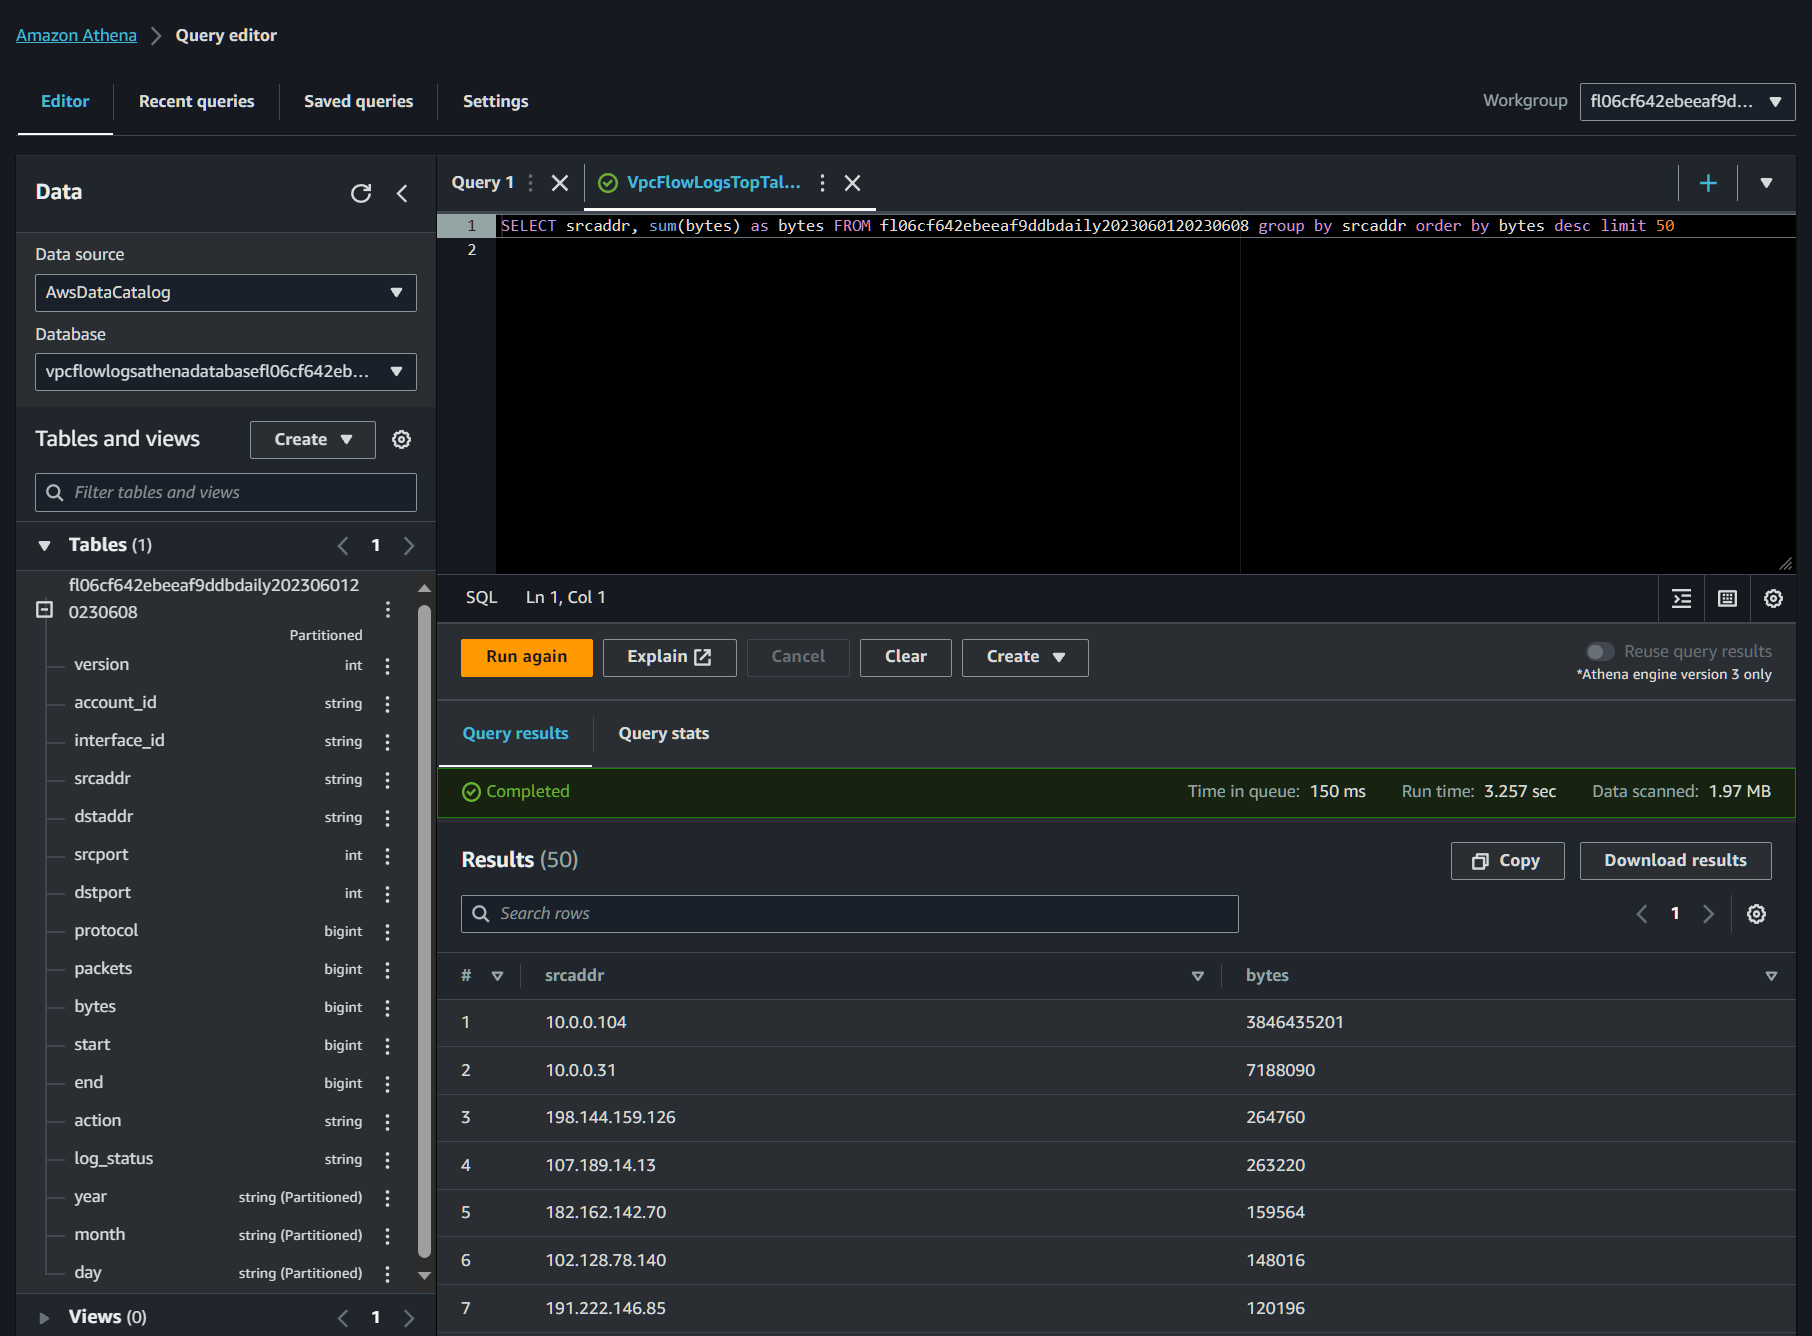
From here you’re presented with the Athena dashboard. Notably, you’ll see saved queries up top and from there you’ll find a list of common VPC Flow Log queries:
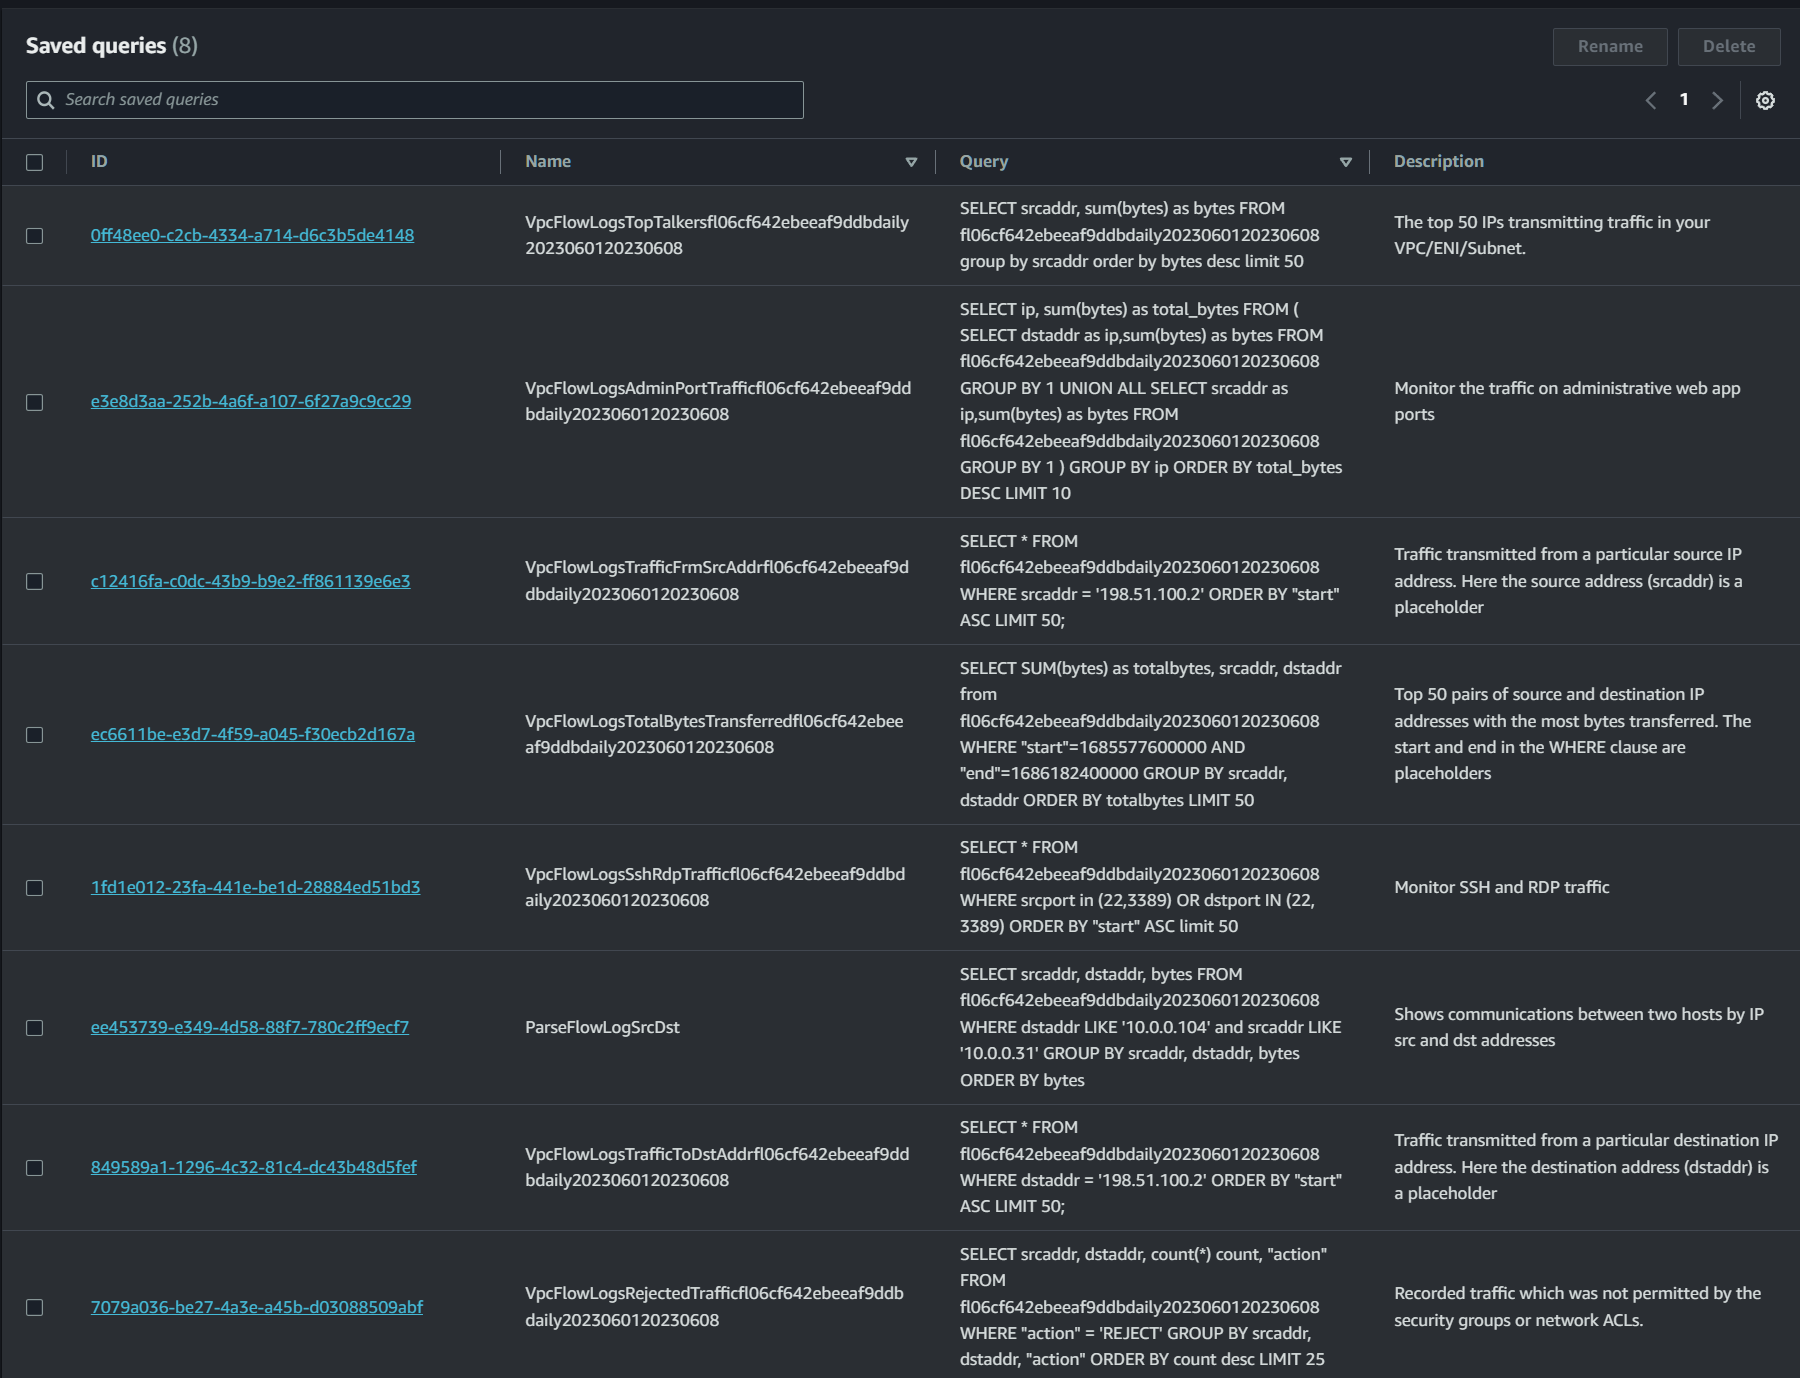
One of my favorites is the “VPCFlowLogsTopTalkers” (shown above) which identifies the top 50 IPs transmitting traffic in your VPC. From here you can snag a source IP and potentially use that as a starting point to identify data transfer across your environment.
You can write your own queries in the query space provided, and if you’re somewhat handy with SQL you’ll find this easy to do. All the fields in the table are listed off to the left, which makes it easy to identify various field and what type of data is contained.
Conclusion
I hope this guide was helpful to you, and at the very least got you thinking of implementing VPC Flow Logs in your AWS environment. No matter which method you choose, getting this information will help you visualize data transfer and enable you to cost optimize your network.