
Tool - Cloud Storage Cost Comparison

If you are in a hurry
(Take a deep breath. May I suggest some CCR? Alternatively, get your jam going while you knock this out. You got this next step!)
Cloud Storage Comparison Worksheet Repo
This worksheet will be utilized during the solution reduction process of assessing solutions, utilizing a cost-efficient approach. Further investigation with more detail of your use case will be required for tighter tolerances of estimation.
If a cell already has a formula, don’t change it unless you are having fun. **Have fun at your risk**
Solutions_Options worksheet:
You can configure up to 10 options/solutions
The “Cost Comparison Table” is a quick view of the cost comparisons. Coloring is based on the column—darker green=lowest cost.
This sheet is straightforward. Plug the values you want in, but you will want to validate the pricing for your desired Region. It’s the last pricing we had in it. Links to the sites are in the sheet at the bottom of the “Pricing Options” worksheet.
Storage Tiers: We generally will have a minimum of two tiers for solutions, but we use this to do single-tier pricing.
Influxes: Migration waves are the same thing as an Influx. We can often rationalize items down to two to three influxes groupings to get the pricing we need for the solution.
Reminders:
Some solutions have multiple tiers. E.g., AWS’ “S3 Intelligent – Tier, Frequent/Infrequent/Archive Instant Access,” where you must put all three.
You can’t have more than 100% distributed across the mixes, or it messes up pricing.
Yellow boxes: My go-to color for inputs. The exception is the tables “Solution Configurations” and “Additional Solution Configurations.” Too much yellow for those tables.
Storage types in the dropdown boxes: This is the Excel feature “Data Validation” setting with the range of all the storage types on the Pricing_Options worksheet. If you added something to that table and it’s not showing up in the list, check the range in the “Data Validation” setting. Editing the Pricing_Options worksheet with your desired choices and Region’s pricing would be best.
Pricing_Options worksheet:
Don’t edit the column names in the first table where pricing for storage types is located. If you do, it will break things. This doesn’t apply to the “Solutions_Options” worksheet unless you unhide the table column name rows.
Don’t edit the Provider names in the three tables after the first one. Azure, AWS, & GCP data transfer fees. In some circumstances, we will use these with pricing for intra-region pricing or other scenarios where the settings fit.
Make sure to get those “Data Retrieval” costs as well. They add up.
Presently there is no support for multiple region selections. Be aware! Adding multiple region pricing will pull the first satisfying solution in the list when pulling pricing.
Formulas worksheet:
Be kind. Our roles are hard enough, and we want to share our work so we all work more efficiently. Time is our most precious commodity. Our way of doing things doesn’t make it the best way, but this is how we got it done this time. We made mistakes. Please help us make it better for everyone.
If you want to know more, contribute to the community or hit us up with questions.
Mess with Row 1, and it will go crazy.
Want to know more:
Summary
One of our top questions asked to us is about cloud storage costs. Common scenarios we utilize this spreadsheet with are:
Cross-cloud and single-provider solution comparisons
Moving from single-tiered storage to multi-tier storage
Tiering use cases
Data retrieval and egress cost estimations
Comparing high-level costs vs. on-premises solution offerings
Rationale
We are saving our time. We leverage spreadsheets because they are quick and easy and provide transparency in calculating the data. If the savings are worth it, utilize the data to help achieve business goals.
Overview of the workbook:
If you see a formula in a cell, don’t edit unless you are having fun.
Cost Comparison Table
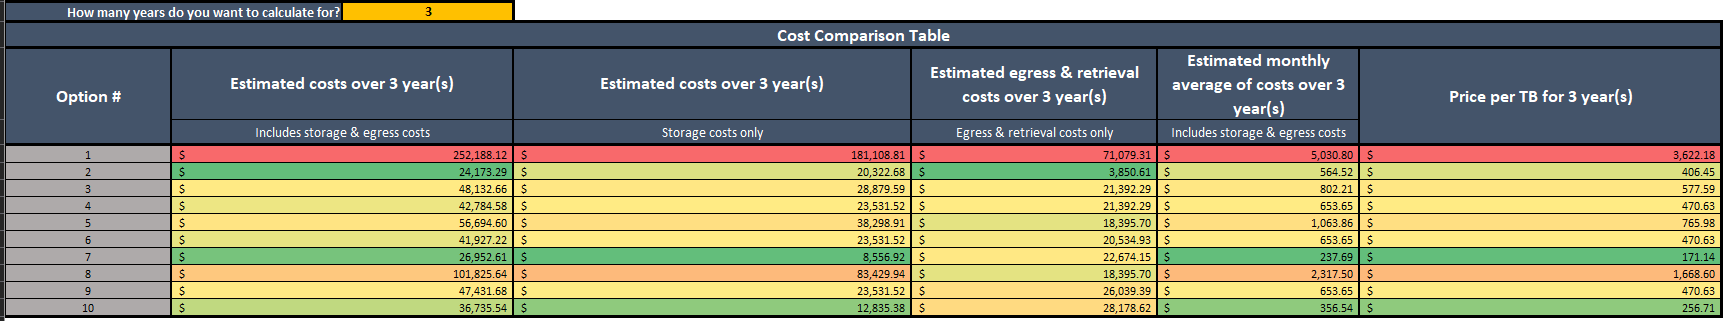
The table provides you with an overview of your solutions and their costs. The darker the green coloring, the lower the costs across the options in that column. Each column is its comparison.
Solutions Configurations Table
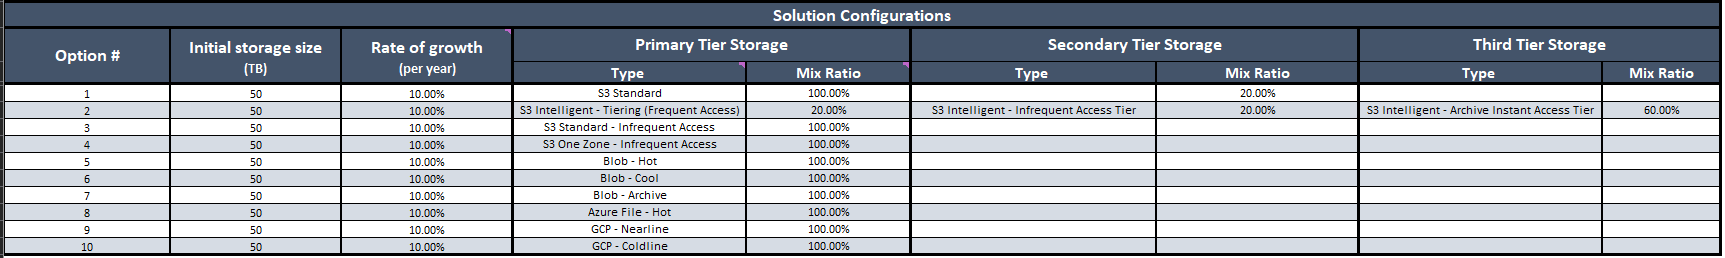
We allow up to ten options to be configured, and you will see that we give you three types of storage tiers. In some cases, such as with AWS S3 Intelligent tiering, you will need to use multiple tiers, or if you are using policies, you can input up to three tiers of storage type with the mix ratio to give you the estimated pricing. If you only need to get pricing for one tier, you also have that capability. We don’t have every type of storage included, but we will show you how to add more storage types later in this article.
The initial amount of storage is needed to calculate, but we recognize that it’s not a fixed amount, so we added the rate of growth column. Generally, the industry average that we have seen for most storage repositories grows from 10% to 35% year over year(YoY), depending on the churn of the data and your use case. Utilize any historical data you might have from monitoring tools, or if you are coming from a dedicated storage provider, they will often have historical data showing growth.
Use case: Single-tier solution to Multi-tier solutions
One everyday use case is moving from a single-tier solution to a multi-tier solution to recognize savings. We generally only see organizations with large data footprints getting private pricing deals on storage, and the best alternative is getting your data into the right tier. First, you will need to validate solution support for tiering. The big caveat is supporting archive tiers with a rehydration process. Thus, it would be best to validate the technical configuration support for the solutions or the level of effort to get an application/solution compliant to meet your use case OLAs.
In my experience, we commonly see close to 30% savings on costs by moving to more cost-effective tiers.
Reminder: For many use cases, it’s a minimal subset of data commonly retrieved or needing the fastest response. As part of operational excellence, tiering is one of the easiest to implement.
Storage Types
The options in the dropdown list are dictated by the range in the “Data Validation” setting under the Data Ribbon for the cell. It’s reading the list in the table under the Pricing_Options in the first column of the table with all the Storage Types and relevant data. You must update this for the appropriate regions you want to utilize for your use cases. Remember to check and see if you can use some of the more cost-effective regions to satisfy your use case.
We commonly keep more solutions in the table to allow for discussions to allow us to change configurations to the options quickly.
Mix Ratios
This needs to equal 100% across the various tiers. It will work even if you are not right at 100%. When considering the ratio, we generally look at the cache size or any data we can grab our hands on utilization. Then we factor in that size for the most cost-efficient solution that meets the SLAs.
Additional Solution Configurations Table
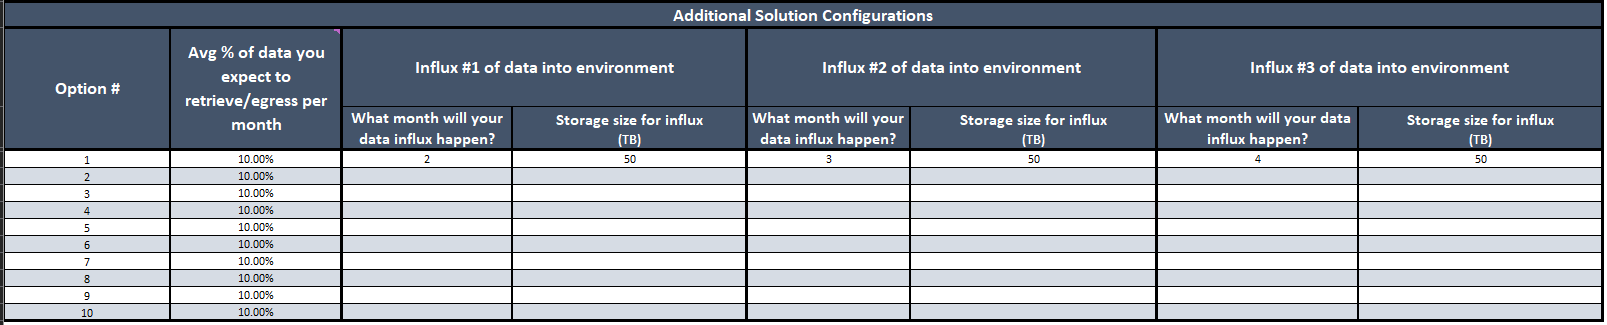
Average % of data you expect to retrieve/egress per month
This is hard to estimate in many use cases but do your best and play with the percentage if you aren’t 100% sure; otherwise, you can leave it blank. The percentage only applies to the primary storage tier as subsequent tiers should be reserved for data that is more non-consistent requested.
Influxes of data
We use this frequently with migration wave planning for costs. Rarely do we see a big-bang solution, as we often do POCs to validate the cost expectations and performance. We do have to consolidate some of the influxes to lump sums commonly, but we rarely see a need to have more than what we can accomplish with three influxes.
Pricing Options Worksheet
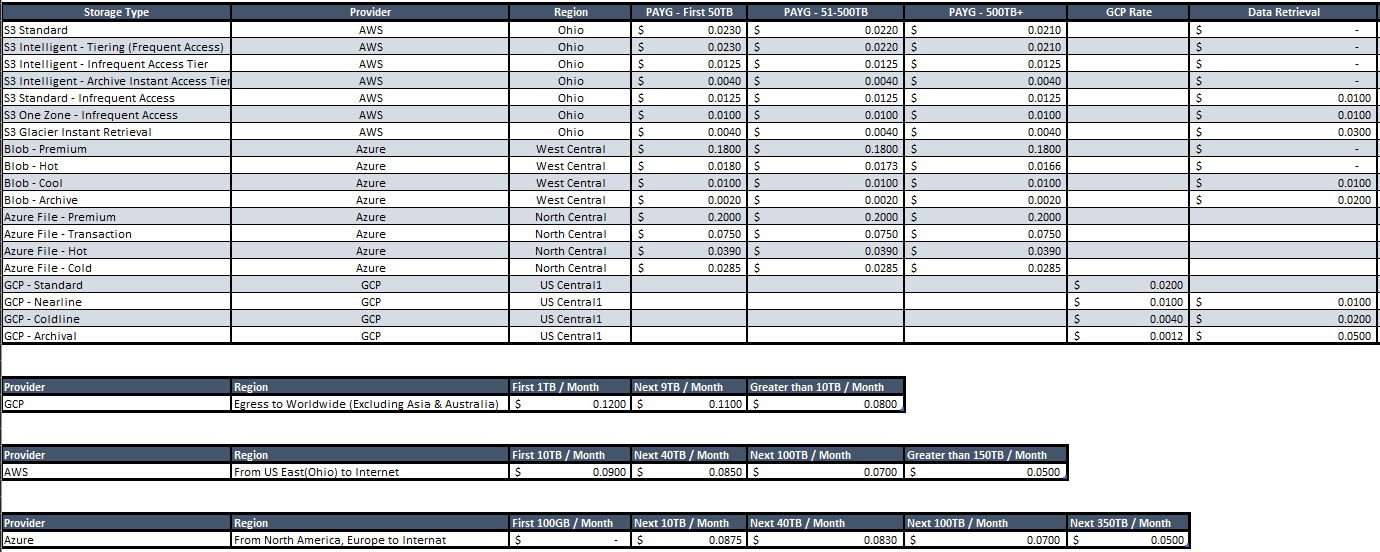
Storage Types Table
The main table at the top has some caveats, such as the column header information being utilized in formulas, so changing any column names will affect formula calculations. As of today, when this was published, we can leverage almost all the solutions offered by the three public cloud providers with minimal setup. We don’t have support for the Region, but we have it there to know what Region is priced out. We know there are 1 & 3 year pricing models out there, which we don’t consider until we get down to the short list of solutions.
Adding more rows
When adding more options, we recommend inserting a row between the top and bottom rows of the existing table. This will allow the range to be updated to include the new options in the dropdown lists on the Solution_Options worksheet for the storage tier solutions.
Data Transfer Tables
The same rule applies here for the column header information, and additionally, the names (GCP, AWS, & Azure) under the provider columns are utilized in formulas. We frequently use this for cross-region costs, but you must update the pricing to work for the existing setup.
Formulas worksheet
You can look through this and see how we set up formulas to help you with your sheets or if you want to see how something works. If you have more specific questions about a formula or find an issue, please let us know so we can share them with everyone.
Wrap-up
We hope this helps you get the job done quickly and start showing the business opportunities for savings. Even if it’s only a tiny amount, it adds up if you spread it across multiple years.